Core Lab Reports Second Quarter 2022 Results From Continuing Operations
- SECOND QUARTER REVENUE OF $120.9 MILLION; UP 5% SEQUENTIALLY; UP 2% YEAR-OVER-YEAR
- SECOND QUARTER SEQUENTIAL INCREMENTAL MARGINS, EX-ITEMS, 43%, DRIVEN BY RESERVOIR DESCRIPTION
- SECOND QUARTER GAAP EPS OF $0.15; EPS, EX-ITEMS, $0.12
- RENEWS AND EXTENDS REVOLVING CREDIT FACILITY THROUGH 2026
- ANNOUNCES Q3 2022 QUARTERLY DIVIDEND
AMSTERDAM, July 27, 2022 /PRNewswire/ -- Core Laboratories N.V. (NYSE: "CLB US" and Euronext Amsterdam: "CLB NA") ("Core", "Core Lab", or the "Company") reported second quarter 2022 revenue of $120,900,000. Sequential revenue growth was adversely impacted by approximately $2,000,000, due to the devaluation of the Euro and British Pound, as well as a decrease in revenue from operations based in Russia. Core's operating income was $11,700,000, with earnings per diluted share ("EPS") of $0.15, all in accordance with U.S. generally accepted accounting principles ("GAAP"). Operating income, ex-items, a non-GAAP financial measure, was $9,600,000, yielding operating margins of 8%, sequential incremental margins of 43%, and EPS, ex-items, of $0.12. An adjustment to reverse previously recognized stock compensation expense was recorded during the second quarter of 2022 for certain performance share awards which are no longer expected to vest. A full reconciliation of non-GAAP financial measures is included in the attached financial tables.
Core's CEO, Larry Bruno stated, "First, our thoughts remain with our Ukrainian employees and their families during the on-going conflict. Turning to Core's results during the second quarter of 2022, we achieved sequential improvement in revenue, operating income, operating margins and EPS; these financial improvements occurred despite somewhat greater than expected business disruptions associated with the geopolitical conflict between Russia and Ukraine. Aside from the areas affected by this conflict, Core sees improving momentum in both onshore and offshore client activity across our global operations."
Russia-Ukraine Conflict
The on-going geopolitical conflict between Russia and Ukraine, along with the associated European and U.S. sanctions, presents some measure of uncertainty for Core's business and financial performance. Over the course of the second quarter of 2022, the military conflict continued and European sanctions against Russian crude oil imports were expanded.
As part of Core's Reservoir Description laboratory network, the Company provides analytical services on crude oil, natural gas and derived products, including both reservoir condition analysis and ambient condition assay work. Disruptions in assay work in parts of Europe, Russia and Ukraine have persisted with the continuing conflict, while traditional supply lines of crude oil and derived products are realigning to new logistical patterns. Given that current global demand for these liquid hydrocarbons remain near pre-conflict levels, Core Lab expects supply patterns to continue realigning, and demand for the Company's associated laboratory services to trend back toward pre-conflict levels.
Liquidity, Free Cash Flow and Dividend
On 9 June 2022, Core Lab announced a $60,000,000 At-The-Market ("ATM") equity offering program. As of 27 July 2022, the Company had not sold any shares under the ATM program.
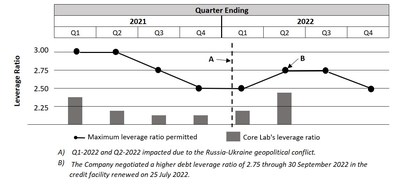
On 25 July 2022, the Company entered into an agreement to renew and extend its revolving credit facility (the "Credit Facility"). The Credit Facility was extended through 25 July 2026 with an aggregate borrowing commitment of $135,000,000, and includes a $50,000,000 accordion option. Additionally, the terms of the Credit Facility provide an increase to the maximum permitted leverage ratio to be equal to (a) 2.75:1.00 through the fiscal quarter ending 30 September 2022; and (b) 2.50:1.00 for the fiscal quarter ending 31 December 2022. For additional information regarding the Credit Facility, see the Form 8-K filed with the Securities and Exchange Commission by the Company on 26 July 2022.
Core Lab initially began to refocus the use of free cash towards reducing long-term debt in the first quarter of 2020. The Company maintains this focused effort and continues to apply free cash primarily towards reducing long-term debt. Long-term debt has been reduced from $295,900,000 as of 31 December 2019 to $171,900,000 as of 30 June 2022, or a cumulative debt reduction of $124,000,000 over the last 30 months. Core will continue applying free cash towards reducing debt until the Company reaches its target leverage ratio (calculated as total net debt divided by trailing twelve months adjusted EBITDA) of 1.5 times or lower. The following graph summarizes the progress towards reducing the leverage ratio during 2021 and the impact both the Russia-Ukraine conflict and significantly higher COVID-19 cases have had on the Company's leverage ratio during the first half of 2022.
Core continues to focus on maximizing free cash flow ("FCF"), a non-GAAP financial measure defined as cash from operations less capital expenditures. For the second quarter of 2022, cash from operations was $600,000 and capital expenditures were $3,200,000, yielding FCF of $(2,600,000). Cash from operations declined sequentially in the second quarter of 2022, primarily due to three factors:
- The Russia-Ukraine conflict negatively impacted the level of sales and revenue as the Company exited the first quarter and began the second quarter of 2022. Consequently, cash collections on accounts receivable were lower during the second quarter of 2022.
- Additional cash was also used to fund working capital requirements, as product sales continue to increase, supply chains remain challenged, and inflationary factors are resulting in higher levels of inventory.
- Cost reduction plans and associated severance obligations accrued in the first quarter of 2022 have been partially executed in the second quarter of 2022. Additionally, unfunded liabilities associated with certain employee retirement plans were paid from operating cash flow.
Core expects the growth in working capital associated with higher levels of inventory to moderate, cash from operations to strengthen and the Company to generate positive free cash in future quarters. Core's free cash will continue to be returned to its shareholders via the Company's regular quarterly dividend as well as being focused towards reducing long-term debt.
On 27 April 2022, Core's Board of Supervisory Directors ("Board") announced a quarterly cash dividend of $0.01 per share of common stock, which was paid on 31 May 2022 to shareholders of record on 9 May 2022. Dutch withholding tax was deducted from the dividend at a rate of 15%.
On 27 July 2022, the Board approved a cash dividend of $0.01 per share of common stock payable in the third quarter of 2022. The third quarter dividend will be payable on 29 August 2022, to shareholders of record on 8 August 2022. Dutch withholding tax will be deducted from the dividend at a rate of 15%.
Reservoir Description
Reservoir Description operations are closely correlated with trends in international and offshore activity levels, with approximately 80% of revenue sourced from outside the United States. Reservoir Description revenue in the second quarter of 2022 was $75,800,000, up 1% sequentially and down 3% year-over-year. While underlying activity has improved in multiple international regions, there are two primary factors impeding the overall revenue growth: 1) the conflict between Russia and Ukraine, and 2) devaluation of the Euro and British Pound. Revenue from operations in Russia in the second quarter of 2022 decreased approximately $800,000 sequentially, and $2,300,000 year-over-year; the revenue decline was $3,200,000 for the first half of 2022 when compared to 2021. Additionally, the sharp devaluation of both the Euro and British Pound during 2022 lowered revenue billed in these currencies when translated into U.S. dollars by $2,900,000 for the second quarter of 2022 and $4,800,000 for the first half of 2022, when compared to 2021. Operating income for the second quarter of 2022 on a GAAP basis was $5,900,000, while operating income, ex-items, was $5,000,000, yielding operating margins of 7% and sequential incremental margins of 102%.
Core Lab's eighty-plus years of expertise evaluating both subsurface geology and fluid flow through natural, porous media are providing Reservoir Description with opportunities in emerging energy transition initiatives. In addition to Core's multi-faceted engagement in Carbon Capture and Sequestration ("CCS") projects, described over the past several quarters, the Company has also been engaged to evaluate subsurface cores tied to lithium extraction opportunities. Lithium is a valuable commodity, essential to the creation of high efficiency batteries. During the second quarter of 2022, Core Lab, under the direction of 3PL Operating Inc., commenced work on a multi-well core project from Railroad Valley, Nevada. 3PL Operating Inc. has targeted a Pliocene continental evaporite sequence with extensive metalliferous deposits that include: sodium, phosphorous, tungsten, boron, lithium, and other metals, potentially making the Railroad Valley deposit one of the most promising in the world of this type. Multiple cored intervals from the 3PL Operating, Inc. Li 10-28 and Li 11-18 wells were recovered from the subsurface and stabilized at the wellsite with Core Lab's proprietary CoreSta™ technology. CoreSta™ is a superior preservation technology specifically invented for friable and unconsolidated formations. Upon arrival at the laboratory, these cores were immediately scanned using Core Lab's proprietary Non-Invasive Testing and Reservoir Optimization ("NITROSM") technologies. Among these, Dual Energy Computed Tomography ("DECT") quickly provided experts at 3PL Operating, Inc. with lithologic information and a wide range of geological and petrophysical parameters, as well as high resolution (millimeter-scale) 3D digital images of the recovered cores. The cores are now progressing through the laboratory analytical program. Geological insights and petrophysical parameters obtained from this analytical program will provide a robust dataset of physical measurements that 3PL Operating, Inc. will use for both economic assessment of the strata and to establish optimized development strategies. All of the analytical data for this important project are being hosted in Core Lab's secure RAPID™ database, which 3PL Operating, Inc. will use as a shared digital workspace.
Also in the second quarter of 2022, a client company in Latin America employed Core Lab's proprietary technologies to improve the utility of heavy and extra-heavy crudes from an onshore field by blending them with lighter crude oils. Laboratory fluid testing, including assessment of the potential for the precipitation of organic solids, is required to verify the viability of the resultant blends. Responding to this need, Core Lab developed and executed a testing protocol using its proprietary imaging system for magnified viewing of fluids and fluid interactions at high temperatures and pressures. This technology uses two methods to evaluate and measure asphaltene flocculation: 1) a high-resolution trinocular microscope for pressurized fluid imaging ("PFI"), and 2) a near infrared ("NIR") spectrophotometer. Combined, these technologies determine the size and shape of flocculated particles at various temperatures and pressures. Successful development and deployment of these technologies, coupled with the growing market for heavy oil blends, has led to the commissioning of similar studies for additional clients in South America in the second half of 2022.
Production Enhancement
Production Enhancement operations, which are focused on complex completions in unconventional, tight-oil reservoirs in the U.S., as well as conventional offshore projects across the globe, posted second quarter 2022 revenue of $45,100,000, up 11%, both sequentially and year-over-year. Operating income on a GAAP basis was $4,900,000, while operating income, ex-items, was $3,900,000, yielding operating margins of 9% and sequential incremental margins of 18%. In the quarter, Core's proprietary product sales experienced growth and market penetration in both U.S. and international markets.
During the second quarter of 2022, working with a client in the North Sea, Core Lab successfully launched its innovative energetic perforating system, Helios™, aimed at improving the efficiency of plug-and-abandonment ("P&A") programs. Helios™ is a technology that creates a high-density perforation matrix, providing improved access to the cement between the outermost casing and the geologic formation. The optimized perforation matrix allows for greater circulation and more efficient removal of debris in the annular space during the perf and wash process. The operator first perforated the casing with the Helios™ technology, and then, utilizing a specialized jet wash tool, circulated fluid between the perforated casing and the formation to create a clean annulus. Cement plugs were subsequently set to secure the well for abandonment. Core's Helios™ technology provided the opportunity to significantly reduce P&A expenses by decreasing rig time, saving the operator up to $4,000,000 per abandoned well versus conventional section milling. Helios™ provides Core's clients with an effective and efficient solution when executing multimillion-dollar P&A programs and demonstrates how Core's Production Enhancement engineers are able to adapt downhole technological advances to evolving industry needs.
Also during the second quarter of 2022, Core's SpectraStim™, SpectraScan™, and PackScan® downhole imaging technologies were utilized in a client's deepwater Gulf of Mexico well to assess a frac pack completion. A successful frac pack requires an effective annular pack; this includes uniform proppant placement across the annulus between the casing and the sand control screen, along with ample proppant reserve above the top of the screen, to accommodate in-filling of any initial voids in the pack. When a successful frac pack is placed, the well is protected from the influx of formation fines that can cut the screen, damage surface facilities, and fill the wellbore with produced solids, all of which can restrict production and potentially compromise the completion. Based upon traditional volumetric measurements during the frac pack treatment, the frac pack was initially interpreted to have been successfully placed. However, when Core's Production Enhancement engineers analyzed the diagnostic data from its SpectraScan™ and PackScan® logging tools, the results revealed a major void in the annular pack, as well as inadequate proppant reserve to cover the top of the screen and/or fill the annular void. Core's team recommended a top-off proppant pumping procedure to ensure complete screen coverage. A relog using Core's PackScan® showed the top-off procedure was successfully completed, avoiding a multimillion-dollar remedial completion intervention.
Return On Invested Capital
The Board and the Company's Executive Management continue to focus on strategies that maximize return on invested capital ("ROIC") and FCF, factors that have high correlation to total shareholder return. Core's commitment to an asset-light business model and disciplined capital stewardship promotes capital efficiency and are designed to produce more predictable and superior long-term ROIC.
The Board has established an internal performance metric of demonstrating superior ROIC performance relative to the oilfield service companies listed as Core's Comp Group by Bloomberg, as the Company continues to believe superior ROIC will result in higher total return to shareholders. Bloomberg's calculations using the latest comparable data available indicate Core Lab's ROIC of 3.8%.
Industry and Core Lab Outlook and Guidance
As we look ahead to the second half of 2022 and into 2023, Core anticipates the crude-oil commodity price will remain elevated, but to be moderately volatile as crude-oil supply and demand may be impacted by uncertainties related to slowing global economic growth. Crude oil supply is projected to tighten as production growth faces limitations due to prolonged underinvestment in many regions around the globe. These crude-oil market fundamentals are reflected in the year-over-year increase in international onshore and offshore rig counts, with oilfield drilling programs being executed and capital spending plans expanding for 2022, 2023 and beyond. Core sees these as leading indicators of a growing international multi-year cycle.
With Core Lab having more than 70% of its revenue exposed to international activity, both business segments remain active on international projects. The Company will have revenue opportunities when wells are completed, stimulated, and once reservoir rock or fluid samples have been collected. Core continues to see modest improvement in client activity across many international regions including the South Atlantic Margin, Latin America, and the Middle East. However, Core Lab's Russia, Ukraine and Western Europe laboratory networks present some uncertainty, as the Russia-Ukraine geopolitical conflict continues and sanctions on Russia have expanded.
Core expects Reservoir Description revenue to improve by low-to-mid single digits in the third quarter of 2022. Year-to-date the international rig count has been flat. When the international rig count sustains improvement and Core's clients drill and sample their reservoirs, Core's Reservoir Description segment is expected to outperform the changes in industry activity levels.
Core's Production Enhancement segment is more exposed to U.S. onshore activity and typically correlates to well stimulation and completion programs. The third quarter 2022 U.S. rig count is projected to increase sequentially, however, the rate of growth for completions may potentially be limited by the availability of third party frac equipment and crews. Consequently, Core's Production Enhancement segment revenue is projected to increase sequentially by mid-to-high single digits.
For the third quarter of 2022, Core projects continued improvement in U.S. activity and moderate improvement in international, offshore and deepwater markets. The realignment of crude-oil supply lines is projected to continue into the third quarter of 2022, having a sequential positive impact on Reservoir Description's assay laboratory testing in the affected regions. Core projects third quarter 2022 revenue to range from $123,000,000 to $129,000,000 and operating income of $10,100,000 to $13,300,000, yielding operating margins of approximately 9%. EPS for the third quarter of 2022 is expected to be $0.13 to $0.18.
The Company's third quarter 2022 guidance is based on projections for underlying operations and excludes gains and losses in foreign exchange. Third quarter 2022 guidance also assumes an effective tax rate of 20%.
Earnings Call Scheduled
The Company has scheduled a conference call to discuss Core's second quarter 2022 earnings announcement. The call will begin at 7:30 a.m. CDT / 2:30 p.m. CEST on Thursday, 28 July 2022. To listen to the call, please go to Core's website at www.corelab.com.
Core Laboratories N.V. is a leading provider of proprietary and patented reservoir description and production enhancement services and products used to optimize petroleum reservoir performance. The Company has over 70 offices in more than 50 countries and is located in every major oil-producing province in the world. This release, as well as other statements we make, includes forward-looking statements regarding the future revenue, profitability, business strategies and developments of the Company made in reliance upon the safe harbor provisions of Federal securities law. The Company's outlook is subject to various important cautionary factors, including risks and uncertainties related to the oil and natural gas industry, business conditions, international markets, international political climates, including the Russia-Ukraine geopolitical conflict, public health crises, such as the COVID-19 pandemic, and any related actions taken by businesses and governments, and other factors as more fully described in the Company's most recent Forms 10-K, 10-Q and 8-K filed with or furnished to the U.S. Securities and Exchange Commission. These important factors could cause the Company's actual results to differ materially from those described in these forward-looking statements. Such statements are based on current expectations of the Company's performance and are subject to a variety of factors, some of which are not under the control of the Company. Because the information herein is based solely on data currently available, and because it is subject to change as a result of changes in conditions over which the Company has no control or influence, such forward-looking statements should not be viewed as assurance regarding the Company's future performance.
The Company undertakes no obligation to publicly update or revise any forward-looking statement to reflect events or circumstances that may arise after the date of this press release, except as required by law.
Visit the Company's website at www.corelab.com. Connect with Core Lab on Facebook, LinkedIn and YouTube.
CORE LABORATORIES N.V. & SUBSIDIARIES | ||||||||||
CONDENSED CONSOLIDATED STATEMENTS OF OPERATIONS | ||||||||||
(amounts in thousands, except per share data) | ||||||||||
(Unaudited) | ||||||||||
Three Months Ended | % Variance | |||||||||
June 30, | March 31, | June 30, | vs. Q1-22 | vs. Q2-21 | ||||||
REVENUE | $120,898 | $115,300 | $118,745 | 4.9 % | 1.8 % | |||||
OPERATING EXPENSES: | ||||||||||
Costs of services and sales | 97,957 | 96,952 | 93,841 | 1.0 % | 4.4 % | |||||
General and administrative expense | 6,847 | 12,545 | 9,670 | (45.4) % | (29.2) % | |||||
Depreciation and amortization | 4,360 | 4,557 | 4,751 | (4.3) % | (8.2) % | |||||
Other (income) expense, net | 82 | 1,637 | (2,317) | (95.0) % | NM | |||||
Total operating expenses | 109,246 | 115,691 | 105,945 | (5.6) % | 3.1 % | |||||
OPERATING INCOME (LOSS) | 11,652 | (391) | 12,800 | NM | (9.0) % | |||||
Interest expense | 2,707 | 2,644 | 2,530 | 2.4 % | 7.0 % | |||||
Income (loss) from continuing operations | 8,945 | (3,035) | 10,270 | NM | (12.9) % | |||||
Income tax expense (benefit) | 1,789 | (1,196) | 2,053 | NM | (12.9) % | |||||
Income (loss) from continuing operations | 7,156 | (1,839) | 8,217 | NM | (12.9) % | |||||
Net income (loss) | 7,156 | (1,839) | 8,217 | NM | (12.9) % | |||||
Net income (loss) attributable to non-controlling interest | 90 | 49 | 157 | NM | NM | |||||
Net income (loss) attributable to Core Laboratories N.V. | $7,066 | $(1,888) | $8,060 | NM | (12.3) % | |||||
Diluted earnings (loss) per share from continuing operations | $0.15 | $(0.04) | $0.17 | NM | (11.8) % | |||||
Diluted earnings (loss) per share attributable to Core Laboratories N.V. | $0.15 | $(0.04) | $0.17 | NM | (11.8) % | |||||
Weighted average common shares outstanding - assuming dilution | 47,143 | 46,298 | 47,103 | 1.8 % | 0.1 % | |||||
Effective tax rate | 20 % | 39 % | 20 % | NM | NM | |||||
SEGMENT INFORMATION: | ||||||||||
Revenue: | ||||||||||
Reservoir Description | $75,818 | $74,754 | $78,252 | 1.4 % | (3.1) % | |||||
Production Enhancement | 45,080 | 40,546 | 40,493 | 11.2 % | 11.3 % | |||||
Total | $120,898 | $115,300 | $118,745 | 4.9 % | 1.8 % | |||||
Operating income (loss): | ||||||||||
Reservoir Description | $5,925 | $361 | $7,265 | 1541.3 % | (18.4) % | |||||
Production Enhancement | 4,949 | (918) | 3,831 | NM | 29.2 % | |||||
Corporate and Other | 778 | 166 | 1,704 | NM | NM | |||||
Total | $11,652 | $(391) | $12,800 | NM | (9.0) % | |||||
"NM" means not meaningful | ||||||||||
CORE LABORATORIES N.V. & SUBSIDIARIES | ||||||
CONDENSED CONSOLIDATED STATEMENTS OF OPERATIONS | ||||||
(amounts in thousands, except per share data) | ||||||
(Unaudited) | ||||||
Six Months Ended June 30, | % Variance | |||||
2022 | 2021 | |||||
REVENUE | $236,198 | $227,128 | 4.0 % | |||
OPERATING EXPENSES: | ||||||
Costs of services and sales | 194,909 | 177,991 | 9.5 % | |||
General and administrative expense | 19,392 | 18,131 | 7.0 % | |||
Depreciation and amortization | 8,917 | 9,622 | (7.3) % | |||
Other (income) expense, net | 1,719 | (3,038) | NM | |||
Total operating expenses | 224,937 | 202,706 | 11.0 % | |||
OPERATING INCOME (LOSS) | 11,261 | 24,422 | (53.9) % | |||
Interest expense | 5,351 | 3,893 | 37.5 % | |||
Income (loss) from continuing operations before income tax expense | 5,910 | 20,529 | (71.2) % | |||
Income tax expense (benefit) | 593 | 4,105 | (85.6) % | |||
Income (loss) from continuing operations | 5,317 | 16,424 | (67.6) % | |||
Net income (loss) | 5,317 | 16,424 | (67.6) % | |||
Net income (loss) attributable to non-controlling interest | 139 | 259 | (46.3) % | |||
Net income (loss) attributable to Core Laboratories N.V. | $5,178 | $16,165 | (68.0) % | |||
Diluted earnings (loss) per share from continuing operations | $0.11 | $0.35 | (68.6) % | |||
Diluted earnings (loss) per share attributable to Core Laboratories N.V. | $0.11 | $0.35 | (68.6) % | |||
Weighted average common shares outstanding - assuming dilution | 47,133 | 46,514 | 1.3 % | |||
Effective tax rate | 10 % | 20 % | (49.8) % | |||
SEGMENT INFORMATION: | ||||||
Revenue: | ||||||
Reservoir Description | $150,572 | $154,738 | (2.7) % | |||
Production Enhancement | 85,626 | 72,390 | 18.3 % | |||
Total | $236,198 | $227,128 | 4.0 % | |||
Operating income (loss): | ||||||
Reservoir Description | $6,287 | $17,317 | (63.7) % | |||
Production Enhancement | 4,030 | 5,391 | (25.2) % | |||
Corporate and Other | 944 | 1,714 | NM | |||
Total | $11,261 | $24,422 | (53.9) % | |||
"NM" means not meaningful | ||||||
CORE LABORATORIES N.V. & SUBSIDIARIES | ||||||||||||||||
CONDENSED CONSOLIDATED BALANCE SHEET | ||||||||||||||||
(amounts in thousands) | ||||||||||||||||
(Unaudited) | ||||||||||||||||
% Variance | ||||||||||||||||
ASSETS: | June 30, | March 31, | December 31, | vs. Q1-22 | vs. Q4-21 | |||||||||||
Cash and cash equivalents | $ | 16,148 | $ | 22,037 | $ | 17,703 | (26.7) % | (8.8) % | ||||||||
Accounts receivable, net | 99,180 | 98,900 | 96,830 | 0.3 % | 2.4 % | |||||||||||
Inventories | 52,551 | 48,224 | 45,443 | 9.0 % | 15.6 % | |||||||||||
Other current assets | 31,742 | 33,031 | 29,079 | (3.9) % | 9.2 % | |||||||||||
Total current assets | 199,621 | 202,192 | 189,055 | (1.3) % | 5.6 % | |||||||||||
Property, plant and equipment, net | 109,176 | 109,926 | 110,952 | (0.7) % | (1.6) % | |||||||||||
Right of use assets | 57,964 | 60,168 | 61,387 | (3.7) % | (5.6) % | |||||||||||
Intangibles, goodwill and other long-term assets, net | 210,779 | 212,632 | 219,459 | (0.9) % | (4.0) % | |||||||||||
Total assets | $ | 577,540 | $ | 584,918 | $ | 580,853 | (1.3) % | (0.6) % | ||||||||
LIABILITIES AND EQUITY: | ||||||||||||||||
Accounts payable | $ | 36,106 | $ | 34,405 | $ | 29,726 | 4.9 % | 21.5 % | ||||||||
Short-term operating lease liabilities | 13,008 | 12,669 | 12,342 | 2.7 % | 5.4 % | |||||||||||
Other current liabilities | 46,795 | 52,688 | 48,714 | (11.2) % | (3.9) % | |||||||||||
Total current liabilities | 95,909 | 99,762 | 90,782 | (3.9) % | 5.6 % | |||||||||||
Long-term debt, net | 186,979 | 189,807 | 188,636 | (1.5) % | (0.9) % | |||||||||||
Long-term operating lease liabilities | 44,231 | 46,883 | 49,286 | (5.7) % | (10.3) % | |||||||||||
Other long-term liabilities | 76,654 | 82,080 | 91,148 | (6.6) % | (15.9) % | |||||||||||
Total equity | 173,767 | 166,386 | 161,001 | 4.4 % | 7.9 % | |||||||||||
Total liabilities and equity | $ | 577,540 | $ | 584,918 | $ | 580,853 | (1.3) % | (0.6) % | ||||||||
"NM" means not meaningful |
CORE LABORATORIES N.V. & SUBSIDIARIES | ||||||||
CONDENSED CONSOLIDATED STATEMENTS OF CASH FLOWS | ||||||||
(amounts in thousands) | ||||||||
(Unaudited) | ||||||||
Six Months Ended June 30, | ||||||||
2022 | 2021 | |||||||
CASH FLOWS FROM OPERATING ACTIVITIES: | ||||||||
Net Income (loss) | $ | 5,317 | $ | 16,424 | ||||
Adjustments to reconcile net income (loss) to net cash provided by operating activities: | ||||||||
Stock-based compensation | 5,218 | 8,086 | ||||||
Depreciation and amortization | 8,917 | 9,622 | ||||||
Deferred income taxes | 530 | 2,732 | ||||||
Accounts receivable | (2,202) | (10,013) | ||||||
Inventories | (6,827) | 480 | ||||||
Accounts payable | 5,062 | 6,536 | ||||||
Other adjustments to net income (loss) | (10,120) | (15,382) | ||||||
Net cash provided by operating activities | $ | 5,895 | $ | 17,473 | ||||
CASH FLOWS FROM INVESTING ACTIVITIES: | ||||||||
Capital expenditures | $ | (5,493) | $ | (5,657) | ||||
Proceeds from insurance recovery | 583 | — | ||||||
Other investing activities | 2,553 | 2,279 | ||||||
Net cash provided by (used in) investing activities | $ | (2,357) | $ | (3,378) | ||||
CASH FLOWS FROM FINANCING ACTIVITIES: | ||||||||
Repayment of long-term debt | $ | (31,000) | $ | (119,000) | ||||
Proceeds from long-term debt | 29,000 | 68,000 | ||||||
Proceeds from issuance of common shares | — | 60,000 | ||||||
Transaction costs on the issuance of common shares | — | (861) | ||||||
Dividends paid | (926) | (909) | ||||||
Repurchase of common shares | (2,166) | (1,031) | ||||||
Other financing activities | (1) | (483) | ||||||
Net cash provided by (used in) financing activities | $ | (5,093) | $ | 5,716 | ||||
NET CHANGE IN CASH AND CASH EQUIVALENTS | (1,555) | 19,811 | ||||||
CASH AND CASH EQUIVALENTS, beginning of period | 17,703 | 13,806 | ||||||
CASH AND CASH EQUIVALENTS, end of period | $ | 16,148 | $ | 33,617 | ||||
Non-GAAP Information
Management believes that the exclusion of certain income and expenses enables it to evaluate more effectively the Company's operations period-over-period and to identify operating trends that could otherwise be masked by the excluded Items. For this reason, management uses certain non-GAAP measures that exclude these Items and believes that this presentation provides a clearer comparison with the results reported in prior periods. The non-GAAP financial measures should be considered in addition to, and not as a substitute for, the financial results prepared in accordance with GAAP, as more fully discussed in the Company's financial statements and filings with the Securities and Exchange Commission.
Reconciliation of Operating Income (Loss), Income (Loss) from Continuing Operations and | ||||||||||||
(amounts in thousands, except per share data) | ||||||||||||
(Unaudited) | ||||||||||||
Operating Income (loss) from Continuing Operations | ||||||||||||
Three Months Ended | ||||||||||||
June 30, | March 31, 2022 | June 30, | ||||||||||
GAAP reported | $ | 11,652 | $ | (391) | $ | 12,800 | ||||||
Stock compensation (1) | (3,303) | 3,850 | — | |||||||||
Severance and other charges | — | 3,332 | — | |||||||||
Bad Debt | — | 810 | — | |||||||||
Foreign exchange losses (gains) | 1,258 | (417) | 352 | |||||||||
Excluding specific items | $ | 9,607 | $ | 7,184 | $ | 13,152 | ||||||
Income (loss) from Continuing Operations | ||||||||||||
Three Months Ended | ||||||||||||
June 30, | March 31, 2022 | June 30, | ||||||||||
GAAP reported | $ | 7,156 | $ | (1,839) | $ | 8,217 | ||||||
Stock compensation (1) | (2,642) | 3,850 | — | |||||||||
Severance and other charges | — | 2,666 | — | |||||||||
Bad Debt | — | 648 | — | |||||||||
Impact of higher (lower) tax rate (2) | — | (1,359) | — | |||||||||
Foreign exchange losses (gains) | 1,007 | (334) | 281 | |||||||||
Excluding specific items | $ | 5,521 | $ | 3,632 | $ | 8,498 | ||||||
Diluted Earnings (Loss) Per Share from Continuing Operations | ||||||||||||
Three Months Ended | ||||||||||||
June 30, | March 31, 2022 | June 30, | ||||||||||
GAAP reported | $ | 0.15 | $ | (0.04) | $ | 0.17 | ||||||
Stock compensation (1) | (0.06) | 0.08 | — | |||||||||
Severance and other charges | — | 0.06 | — | |||||||||
Bad Debt | — | 0.01 | — | |||||||||
Impact on assuming dilution | — | 0.01 | — | |||||||||
Impact of higher (lower) tax rate (2) | — | (0.03) | — | |||||||||
Foreign exchange losses (gains) | 0.03 | (0.01) | 0.01 | |||||||||
Excluding specific items | $ | 0.12 | $ | 0.08 | $ | 0.18 | ||||||
(1) Three months ended June 30, 2022 includes reversals of stock compensation expense previously recognized due to a change in | ||||||||||||
Segment Information | ||||||||||||
(amounts in thousands) | ||||||||||||
(Unaudited) | ||||||||||||
Operating Income (Loss) from Continuing Operations | ||||||||||||
Three Months Ended June 30, 2022 | ||||||||||||
Reservoir Description | Production Enhancement | Corporate and Other | ||||||||||
GAAP reported | $ | 5,925 | $ | 4,949 | $ | 778 | ||||||
Foreign exchange losses | 1,180 | 132 | (54) | |||||||||
Stock compensation | (2,103) | (1,200) | — | |||||||||
Excluding specific items | $ | 5,002 | $ | 3,881 | $ | 724 | ||||||
Return on Invested Capital
Return on Invested Capital ("ROIC") is presented based on management's belief that this non-GAAP measure is useful information to investors and management when comparing profitability and the efficiency with which capital has been employed over time relative to other companies. The Board has established an internal performance metric of demonstrating superior ROIC performance relative to the oilfield service companies listed as Core's Comp Group by Bloomberg. ROIC is not a measure of financial performance under GAAP and should not be considered as an alternative to net income.
ROIC of 3.8% is defined by Bloomberg as Net Operating Profit After Tax ("NOPAT") of $14.7 million divided by Average Total Invested Capital ("Average TIC") of $384.8 million where NOPAT is defined as GAAP net income before minority interest plus the sum of income tax expense, interest expense, and pension expense less pension service cost and tax effect on income before interest and tax expense. Average TIC is defined as average of beginning and ending periods' GAAP stockholder's equity plus the sum of net long-term debt, lease liabilities, allowance for doubtful accounts, net balance of deferred taxes, and income tax payable.
Free Cash Flow
Core uses the non-GAAP measure of free cash flow to evaluate its cash flows and results of operations. Free cash flow is an important measurement because it represents the cash from operations, in excess of capital expenditures, available to operate the business and fund non-discretionary obligations. Free cash flow is not a measure of operating performance under GAAP and should not be considered in isolation nor construed as an alternative consideration to operating income, net income, earnings per share, or cash flows from operating, investing, or financing activities, each as determined in accordance with GAAP. Free cash flow should not be considered a measure of liquidity. Moreover, since free cash flow is not a measure determined in accordance with GAAP and thus is susceptible to varying interpretations and calculations, free cash flow as presented may not be comparable to similarly titled measures presented by other companies.
Computation of Free Cash Flow | |||||||||
(amounts in thousands) | |||||||||
(Unaudited) | |||||||||
Three Months Ended | Six Months Ended | ||||||||
June 30, 2022 | June 30, 2022 | ||||||||
Net cash provided by operating activities | $ | 605 | $ | 5,895 | |||||
Capital expenditures | (3,196) | (5,493) | |||||||
Free cash flow | $ | (2,591) | $ | 402 | |||||
![]()
![]() View original content to download multimedia:https://www.prnewswire.com/news-releases/core-lab-reports-second-quarter-2022-results-from-continuing-operations-301594748.html
View original content to download multimedia:https://www.prnewswire.com/news-releases/core-lab-reports-second-quarter-2022-results-from-continuing-operations-301594748.html
SOURCE Core Laboratories N.V.
