JLL Reports Financial Results for Fourth-Quarter and Full-Year 2022
Continued growth in annuity-based businesses overshadowed by market-driven softness in leasing and capital markets
CHICAGO, Feb. 28, 2023 /PRNewswire/ -- Jones Lang LaSalle Incorporated (NYSE: JLL) today reported operating performance for 2022 with fourth-quarter diluted earnings per share of $3.62 and adjusted diluted earnings per share1 of $4.36, and full-year diluted earnings per share of $13.27 and adjusted diluted earnings per share1 of $15.71.
- Fourth-quarter revenue was $5.6 billion, down 2% in LC, and fee revenue1 was $2.2 billion, down 16% in LC, compared with a record 2021
- Outsourcing wins and strong close to the year for Project Management drove increase in Work Dynamics
- Sharp decline in market volumes and elongated deal cycles continued, contributing to the drop in Capital Markets
- Lower Markets Advisory revenue was attributable to pullback in leasing activity across asset classes
- Margin contraction for the fourth quarter driven primarily by three factors:
- Decrease in equity earnings from both JLL Technologies and LaSalle, which comprised over 75% of net margin contraction
- Decline in higher-margin transaction-based revenue
- Higher fixed compensation expense
"JLL's fourth-quarter performance reflected the industry-wide slowdown in investment sales and leasing volumes caused by the rapid increase in interest rates and the peak of recent inflationary pressures," said Christian Ulbrich, JLL CEO. "Once again, the resilience and diversification of our platform was evidenced by strong fee revenue growth in our annuity businesses, especially within Work Dynamics. We remain focused on driving efficiencies in our operating platform and have reduced our cost structure in light of the challenging economic environment. We expect market conditions to recover across much of the world in the second half of 2023 and are confident in our ability to gain share, generate long-term profitable growth and achieve our 2025 financial targets."
Summary Financial Results ($ in millions, except per share data, "LC" = local currency) | Three Months Ended December 31, | Year Ended December 31, | |||||||||
2022 | 2021 | % Change | % Change | 2022 | 2021 | % Change | % Change | ||||
Revenue | $ 5,604.8 | $ 5,945.7 | (6) % | (2) % | $ 20,862.1 | $ 19,367.0 | 8 % | 11 % | |||
Fee revenue1 | 2,214.1 | 2,748.1 | (19) | (16) | 8,302.0 | 8,017.5 | 4 | 7 | |||
Net income attributable to common shareholders | $ 174.8 | $ 421.4 | (59) % | (55) % | $ 654.5 | $ 961.6 | (32) % | (30) % | |||
Adjusted net income attributable to common shareholders1 | 210.6 | 447.0 | (53) | (49) | 775.1 | 1,013.6 | (24) | (21) | |||
Diluted earnings per share | $ 3.62 | $ 8.16 | (56) % | (52) % | $ 13.27 | $ 18.47 | (28) % | (26) % | |||
Adjusted diluted earnings per share1 | 4.36 | 8.66 | (50) | (46) | 15.71 | 19.47 | (19) | (17) | |||
Adjusted EBITDA1 | $ 338.5 | $ 622.0 | (46) % | (42) % | $ 1,247.3 | $ 1,496.5 | (17) % | (14) % | |||
Free Cash Flow 6 | $ 532.0 | $ 697.8 | (24) % | n/a | $ (5.9) | $ 796.5 | (101) % | n/a | |||
Note: For discussion and reconciliation of non-GAAP financial measures, see the Notes following the Financial Statements in this news release. |
Consolidated 2022 Performance Highlights: | |||||||||||||||
Consolidated
| Three Months Ended December 31, | % | % | Year Ended December 31, | % | % | |||||||||
2022 | 2021 | 2022 | 2021 | ||||||||||||
Markets Advisory | $ 1,186.3 | $ 1,364.8 | (13) % | (10) % | $ 4,415.5 | $ 4,188.7 | 5 % | 8 % | |||||||
Capital Markets | 607.9 | 976.4 | (38) | (35) | 2,488.2 | 2,620.5 | (5) | (1) | |||||||
Work Dynamics | 3,634.6 | 3,396.8 | 7 | 11 | 13,268.5 | 11,891.5 | 12 | 15 | |||||||
JLL Technologies | 57.3 | 44.4 | 29 | 30 | 213.9 | 166.2 | 29 | 30 | |||||||
LaSalle | 118.7 | 163.3 | (27) | (23) | 476.0 | 500.1 | (5) | 1 | |||||||
Total revenue | $ 5,604.8 | $ 5,945.7 | (6) % | (2) % | $ 20,862.1 | $ 19,367.0 | 8 % | 11 % | |||||||
Gross contract costs1 | (3,392.5) | (3,181.8) | 7 | 11 | (12,549.1) | (11,290.2) | 11 | 15 | |||||||
Net non-cash MSR and mortgage banking | 1.8 | (15.8) | (111) | (111) | (11.0) | (59.3) | (81) | (81) | |||||||
Total fee revenue1 | $ 2,214.1 | $ 2,748.1 | (19) % | (16) % | $ 8,302.0 | $ 8,017.5 | 4 % | 7 % | |||||||
Markets Advisory | 915.3 | 1,101.1 | (17) | (14) | 3,360.2 | 3,201.7 | 5 | 8 | |||||||
Capital Markets | 598.9 | 947.3 | (37) | (34) | 2,430.2 | 2,513.2 | (3) | — | |||||||
Work Dynamics | 534.3 | 503.6 | 6 | 11 | 1,864.7 | 1,692.2 | 10 | 15 | |||||||
JLL Technologies | 54.2 | 40.1 | 35 | 36 | 200.2 | 137.2 | 46 | 47 | |||||||
LaSalle | 111.4 | 156.0 | (29) | (24) | 446.7 | 473.2 | (6) | 1 | |||||||
Operating income | $ 254.7 | $ 445.6 | (43) % | (41) % | $ 868.1 | $ 1,043.5 | (17) % | (15) % | |||||||
Equity (losses) earnings | $ (21.6) | $ 102.7 | (121) % | (121) % | $ 51.0 | $ 209.4 | (76) % | (76) % | |||||||
Adjusted EBITDA1 | $ 338.5 | $ 622.0 | (46) % | (42) % | $ 1,247.3 | $ 1,496.5 | (17) % | (14) % | |||||||
n.m. - not meaningful as represented by a percentage change of greater than 1,000%, favorably or unfavorably. | |||||||||||||||
Note: For discussion and reconciliation of non-GAAP financial measures, see the Notes following the Financial Statements in this news release. Percentage variances in the Performance Highlights below are calculated and presented on a local currency basis, unless otherwise noted. | |||||||||||||||
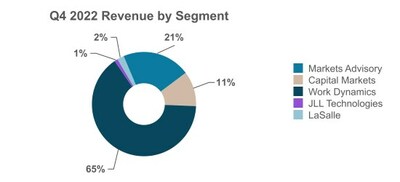
Revenue
Following record performance in the fourth quarter of 2021, revenue and fee revenue decreased 2% and 16%, respectively, this quarter. Transaction-based businesses, notably Investment Sales and Debt Advisory within Capital Markets as well as Leasing within Markets Advisory, experienced challenges from continued uncertainty in interest rates and degrading economic sentiment across the globe that began to impact these businesses in the third quarter. However, resilient annuity-based businesses continued to deliver solid fee revenue growth for the quarter as Workplace Management, within Work Dynamics, grew 19%; Property Management, within Markets Advisory, grew 8%; JLL Technologies had organic growth of 21%; and LaSalle advisory fees grew 16%.
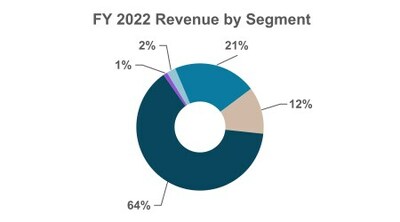
For the full year, strong performance in the first half of 2022 across JLL more than offset headwinds noted in the quarter performance above, with revenue and fee revenue increasing 11% and 7%, respectively. This was primarily due to double-digit growth in Work Dynamics each quarter of 2022 and strong contributions during the first half of 2022 from Leasing, within Markets Advisory, and Investment Sales within Capital Markets.
LaSalle's decrease in revenue for the fourth quarter and full year was driven by lower incentive fees, which more than offset the double-digit advisory fee growth. Dry powder for future deployment remains strong as LaSalle continues to raise capital and redemption requests have not been significant.
Refer to segment performance highlights for additional detail.
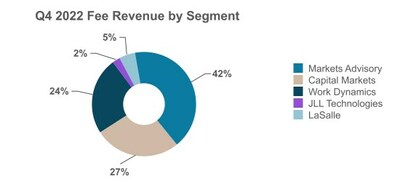
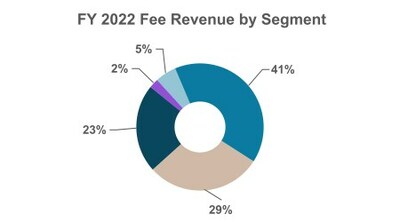
The following charts reflect the segment proportion of revenue and fee revenue for the current quarter and full year.
Net income, Adjusted EBITDA and Margin Performance
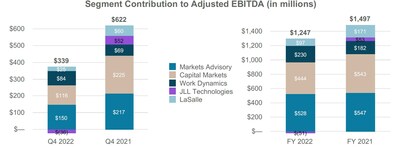
Net income attributable to common shareholders for the fourth quarter was $174.8 million, compared with $421.4 million in 2021, and Adjusted EBITDA was $338.5 million, compared with $622.0 million last year. For the full year, net income attributable to common shareholders was $654.5 million in 2022, compared with $961.6 million last year, and Adjusted EBITDA was $1,247.3 million, compared with $1,496.5 million in 2021. For the fourth quarter and full year, interest expense, net of interest income, increased $16.6 million and $35.1 million, respectively, compared with the prior-year periods, due to an increase in the average outstanding borrowings under our credit facilities in addition to a higher effective interest rate.
The fourth-quarter adjusted EBITDA margin, calculated on a fee-revenue basis, was 15.3% in USD (and 15.5% local currency), compared with 22.6% in 2021. The lower margin compared with an outsized prior-year quarter was largely driven by (i) the $124.3 million decrease in equity earnings, largely from JLL Technologies and LaSalle, which comprised over 75% of the net margin contraction, (ii) the decline in higher-margin transaction-based revenue, specifically Leasing and Investment Sales, and (iii) higher fixed compensation expense, reflecting increased headcount and wage inflation over the trailing twelve months. In addition, the consolidated margin, and all segment margins, reflected comparatively lower annual incentive compensation accruals this year due to business performance.
The full-year 2022 adjusted EBITDA margin, calculated on a fee-revenue basis, was 15.0% in USD and local currency, compared with 18.7% in 2021. The full-year margin contraction was primarily attributable to (i) the $158.4 million decrease in equity earnings, which comprised over 50% of the margin decline, (ii) higher fixed compensation expense, with similar drivers noted in the quarterly margin commentary above, (iii) incremental T&E and marketing expense, and (iv) additional investments in technology. In addition, margin performance for the full year was impacted by the annual incentive compensation driver noted in the quarterly margin commentary.
The following charts reflect the composition of Adjusted EBITDA by segment for the fourth quarter and full year of 2022.
Cash Flows and Capital Allocation:
Free Cash Flow6 was an inflow of $532.0 million for the fourth quarter of 2022, compared with an inflow of $697.8 million in the prior-year quarter. This lower quarter-to-date cash inflow was primarily attributable to lower cash provided by earnings, partially offset by a net inflow related to changes in net reimbursable receivables/payables.
Year to date, Free Cash Flow6 was an outflow of $5.9 million through December 31, 2022, compared with an inflow of $796.5 million in the prior year. The year-over-year change was primarily due to (i) higher commission payments in 2022, reflecting greater payments in early 2022 for commissions earned from the strong performance in the prior-year fourth quarter as well as incremental commissions this year, attributable to the full-year Leasing growth and changes to the Capital Markets incentive compensation structure, (ii) higher annual incentive compensation payments, typically paid in the first quarter, compared with 2021, (iii) lower cash provided by earnings, and (iv) an incremental $59.0 million of cash paid for taxes.
There were no share repurchases during the fourth quarter of 2022. Year to date, approximately 2,923,000 shares have been repurchased, returning $601.2 million to shareholders this year, compared with approximately 1,452,000 shares repurchased and $343.3 million of capital returned during 2021.
Net Debt, Leverage and Liquidity6:
Total net debt was $1,244.0 million as of December 31, 2022, representing a decrease of $453.6 million from September 30, 2022, and an increase of $868.1 million from December 31, 2021. The decrease from September 30, 2022, primarily reflected solid cash flow from operating activities in the fourth quarter. The year-over-year increase was substantially attributable to (i) the two compensation payment drivers noted in the year-to-date Free Cash Flow narrative, (ii) $601.2 million of share repurchases during 2022, and (iii) $142.9 million of net capital contributions, primarily related to JLL Technologies' investment activity.
The company's Net Leverage Ratio was 1.0x as of December 31, 2022, compared with 1.1x as of September 30, 2022, and 0.2x as of December 31, 2021.
Corporate Liquidity was $2.6 billion as of December 31, 2022.
Markets Advisory 2022 Performance Highlights: | |||||||||||||||
Markets Advisory
| Three Months Ended December 31, | % | % | Year Ended December 31, | % | % | |||||||||
2022 | 2021 | 2022 | 2021 | ||||||||||||
Revenue | $ 1,186.3 | $ 1,364.8 | (13) % | (10) % | $ 4,415.5 | $ 4,188.7 | 5 % | 8 % | |||||||
Gross contract costs1 | (271.0) | (263.7) | 3 | 8 | (1,055.3) | (987.0) | 7 | 10 | |||||||
Fee revenue1 | $ 915.3 | $ 1,101.1 | (17) % | (14) % | $ 3,360.2 | $ 3,201.7 | 5 % | 8 % | |||||||
Leasing | 739.9 | 928.6 | (20) | (18) | 2,736.7 | 2,598.5 | 5 | 7 | |||||||
Property Management | 136.5 | 133.8 | 2 | 8 | 500.2 | 478.7 | 4 | 9 | |||||||
Advisory, Consulting and Other | 38.9 | 38.7 | 1 | 9 | 123.3 | 124.5 | (1) | 5 | |||||||
Segment operating income | $ 127.4 | $ 194.4 | (34) % | (32) % | $ 448.0 | $ 471.0 | (5) % | (3) % | |||||||
Adjusted EBITDA1 | $ 150.2 | $ 217.4 | (31) % | (24) % | $ 527.5 | $ 546.5 | (3) % | 1 % | |||||||
Note: For discussion and reconciliation of non-GAAP financial measures, see the Notes following the Financial Statements in this news release. Percentage variances in the Performance Highlights below are calculated and presented on a local currency basis, unless otherwise noted. |
The fourth-quarter decline in Markets Advisory revenue and fee revenue was due to Leasing, which saw lower transaction volume across asset types and a decrease in average deal size, particularly in the office sector. Specifically in the U.S., the slowdown was most pronounced in >100,000 square feet office leases, amidst economic and interest rate uncertainty. On a full-year basis, Leasing achieved solid revenue and fee revenue growth following a record prior year, propelled by a strong first half of 2022. The U.S. and Canada, primarily from organic contributions, led the increase in Property Management fee revenue for both the fourth quarter and the full year.
The fourth-quarter adjusted EBITDA margin, calculated on a fee-revenue basis, was 16.4% in USD (17.4% in local currency), compared with 19.7% in 2021. The margin contraction was primarily due to lower Leasing fee revenue and incremental fixed compensation expenses, driven by incremental headcount and wage inflation over the trailing twelve months.
The full-year adjusted EBITDA margin, calculated on a fee-revenue basis, was 15.7% in USD (16.0% in local currency), compared with 17.1% in 2021. The margin contraction for the full year was primarily attributable to (i) the incremental fixed compensation driver noted above, (ii) incremental T&E and marketing expenses and (iii) additional investments in technology, partially offset by higher revenue.
Capital Markets 2022 Performance Highlights: | |||||||||||||||
Capital Markets
| Three Months Ended December 31, | % | % | Year Ended December 31, | % | % | |||||||||
2022 | 2021 | 2022 | 2021 | ||||||||||||
Revenue | $ 607.9 | $ 976.4 | (38) % | (35) % | $ 2,488.2 | $ 2,620.5 | (5) % | (1) % | |||||||
Gross contract costs1 | (10.8) | (13.3) | (19) | (11) | (47.0) | (48.0) | (2) | 7 | |||||||
Net non-cash MSR and mortgage banking | 1.8 | (15.8) | (111) | (111) | (11.0) | (59.3) | (81) | (81) | |||||||
Fee revenue1 | $ 598.9 | $ 947.3 | (37) % | (34) % | $ 2,430.2 | $ 2,513.2 | (3) % | — % | |||||||
Investment Sales, Debt/Equity Advisory and | 458.1 | 797.2 | (43) | (40) | 1,906.7 | 2,013.2 | (5) | (2) | |||||||
Valuation Advisory | 103.7 | 109.0 | (5) | 3 | 365.6 | 359.8 | 2 | 9 | |||||||
Loan Servicing | 37.1 | 41.1 | (10) | (10) | 157.9 | 140.2 | 13 | 13 | |||||||
Segment operating income | $ 96.8 | $ 226.9 | (57) % | (55) % | $ 389.3 | $ 537.6 | (28) % | (25) % | |||||||
Adjusted EBITDA1 | $ 115.9 | $ 224.9 | (48) % | (46) % | $ 444.0 | $ 543.2 | (18) % | (16) % | |||||||
Note: For discussion and reconciliation of non-GAAP financial measures, see the Notes following the Financial Statements in this news release. Percentage variances in the Performance Highlights below are calculated and presented on a local currency basis, unless otherwise noted. | |||||||||||||||
The fourth-quarter and full-year declines in Capital Markets revenue and fee revenue were substantially driven by lower Investment Sales and Debt Advisory fees as rising interest rates and economic uncertainty adversely impacted market transaction volumes and elongated the deal-cycle time. This driver was particularly impactful on the second half of 2022, where declining revenues in the third and fourth quarters reversed favorable year-over-year revenue trends achieved early in 2022. Globally, fourth-quarter market volumes for investment sales were down 58% in USD (56% in local currency) and full-year global market volumes fell 19% in USD (15% in local currency) according to JLL Research. For the full year, higher Loan Servicing revenue reflected net growth of the servicing portfolio, particularly from loans originated under the Fannie Mae DUS program. For the fourth quarter, the decline in Loan Servicing fee revenue was due to a $7.2 million decrease in prepayment fees compared with the prior-year quarter (the change in prepayment fees were not a meaningful year-over-year revenue driver for the full year).
The fourth-quarter adjusted EBITDA margin, calculated on a fee-revenue basis, was 19.4% in USD (19.3% in local currency), compared with 23.7% in 2021. The margin contraction was primarily due to (i) the decline in fee revenue, (ii) higher commissions, reflecting changes to the incentive compensation structure in 2022, which were partially offset by a reduction to non-commission bonus plans, and (iii) higher fixed compensation expense related to incremental headcount and wage inflation over the trailing twelve months.
The full-year adjusted EBITDA margin, calculated on a fee-revenue basis, was 18.3% in USD (18.2% in local currency), compared with 21.6% in 2021. The margin decline was primarily driven by the expense drivers noted in the quarterly narrative as well as incremental T&E, marketing expense, and investments in technology. In addition, approximately 60 basis points of the net margin contraction was attributable to the year-over-year non-cash change in loan loss credit reserves, primarily from reductions to the reserves recognized in 2021 that did not recur this year.
Work Dynamics 2022 Performance Highlights: | |||||||||||||||
Work Dynamics
| Three Months Ended December 31, | % | % | Year Ended December 31, | % | % | |||||||||
2022 | 2021 | 2022 | 2021 | ||||||||||||
Revenue | $ 3,634.6 | $ 3,396.8 | 7 % | 11 % | $ 13,268.5 | $ 11,891.5 | 12 % | 15 % | |||||||
Gross contract costs1 | (3,100.3) | (2,893.2) | 7 | 12 | (11,403.8) | (10,199.3) | 12 | 16 | |||||||
Fee revenue1 | $ 534.3 | $ 503.6 | 6 % | 11 % | $ 1,864.7 | $ 1,692.2 | 10 % | 15 % | |||||||
Workplace Management | 202.3 | 176.6 | 15 | 19 | 752.8 | 654.9 | 15 | 18 | |||||||
Project Management | 250.1 | 232.9 | 7 | 13 | 850.7 | 774.2 | 10 | 15 | |||||||
Portfolio Services and Other | 81.9 | 94.1 | (13) | (9) | 261.2 | 263.1 | (1) | 3 | |||||||
Segment operating income | $ 64.6 | $ 52.0 | 24 % | 18 % | $ 158.4 | $ 115.8 | 37 % | 30 % | |||||||
Adjusted EBITDA1 | $ 83.9 | $ 68.6 | 22 % | 20 % | $ 230.1 | $ 182.4 | 26 % | 24 % | |||||||
"Workplace Management" was previously called Integrated Facilities Management (IFM). "Project Management" was previously called Project & Development Services. | |||||||||||||||
Note: For discussion and reconciliation of non-GAAP financial measures, see the Notes following the Financial Statements in this news release. Percentage variances in the Performance Highlights below are calculated and presented on a local currency basis, unless otherwise noted. | |||||||||||||||
Work Dynamics revenue and fee revenue increased for both the fourth quarter and full year, driven by double-digit growth in Workplace Management and Project Management, which was broad-based across geographies. New client wins and the expansion of existing global mandates drove the growth in Workplace Management. Project Management saw continued momentum from the higher project demand experienced this year from the return-to-office movement and fewer pandemic-driven restrictions. The decline in Portfolio Services revenue reflected the meaningful correlation between Portfolio Services activity and Leasing activity.
The fourth-quarter adjusted EBITDA margin, calculated on a fee-revenue basis, was 15.7% in USD (14.7% in local currency), compared with 13.6% in the prior-year quarter. The margin expansion was attributable to the fee revenue growth described above and continued cost management strategies, partially offset by incremental investments in technology and people, inclusive of additional headcount and wage inflation.
The full-year adjusted EBITDA margin, calculated on a fee-revenue basis, was 12.3% in USD (11.6% in local currency), compared with 10.8% in 2021. The drivers of margin expansion for the full year were consistent with the quarterly narrative above.
JLL Technologies 2022 Performance Highlights: | |||||||||||||||
JLL Technologies
| Three Months Ended December 31, | % | % | Year Ended December 31, | % | % | |||||||||
2022 | 2021 | 2022 | 2021 | ||||||||||||
Revenue | $ 57.3 | $ 44.4 | 29 % | 30 % | $ 213.9 | $ 166.2 | 29 % | 30 % | |||||||
Gross contract costs1 | (3.1) | (4.3) | (28) | (28) | (13.7) | (29.0) | (53) | (53) | |||||||
Fee revenue1 | $ 54.2 | $ 40.1 | 35 % | 36 % | $ 200.2 | $ 137.2 | 46 % | 47 % | |||||||
Segment operating loss | $ (22.4) | $ (34.3) | 35 % | 33 % | $ (112.9) | $ (97.9) | (15) % | (17) % | |||||||
Equity (losses) earnings | $ (17.9) | $ 82.6 | (122) % | (122) % | $ 46.6 | $ 140.7 | (67) % | (67) % | |||||||
Adjusted EBITDA1 | $ (36.2) | $ 51.6 | (170) % | (172) % | $ (50.9) | $ 53.4 | (195) % | (199) % | |||||||
Note: For discussion and reconciliation of non-GAAP financial measures, see the Notes following the Financial Statements in this news release. Percentage variances in the Performance Highlights below are calculated and presented on a local currency basis, unless otherwise noted. | |||||||||||||||
JLL Technologies organic fee revenue increased 21% for the quarter (23% for the full year), driven by new customers as well as growth from existing customers in software and solutions offerings.
Equity earnings in 2021 were primarily attributable to valuation increases to JLL Technologies' investments, largely reflecting subsequent financing rounds at increased per-share values. Net equity losses in the fourth quarter of 2022 resulted from valuation declines and an impairment in the carrying value of an investment, coupled with fewer valuation increases across the portfolio than in 2021. These items together with more modest net valuation increases this year, compared with 2021, resulted in lower equity earnings for the full year.
The fourth-quarter adjusted EBITDA margin, calculated on a fee-revenue basis, was negative 66.8% in USD (negative 67.9% in local currency), compared with 128.7% in 2021. The change in equity earnings (losses), net of carried interest, drove over 90% of the net margin contraction for the quarter. The remaining decline in margin was primarily attributable to higher fixed compensation expense (inclusive of headcount growth and wage inflation).
The full-year adjusted EBITDA margin, calculated on a fee-revenue basis, was negative 25.4% in USD (negative 26.1% in local currency), compared with 38.9% last year. The margin drivers for the full year were consistent with the quarterly narrative noted above with the change in equity earnings, net of carried interest, driving more than 75% of the net full-year margin decline.
LaSalle 2022 Performance Highlights: | |||||||||||||||
LaSalle
| Three Months Ended December 31, | % | % | Year Ended December 31, | % | % | |||||||||
2022 | 2021 | 2022 | 2021 | ||||||||||||
Revenue | $ 118.7 | $ 163.3 | (27) % | (23) % | $ 476.0 | $ 500.1 | (5) % | 1 % | |||||||
Gross contract costs1 | (7.3) | (7.3) | — | 2 | (29.3) | (26.9) | 9 | 9 | |||||||
Fee revenue1 | $ 111.4 | $ 156.0 | (29) % | (24) % | $ 446.7 | $ 473.2 | (6) % | 1 % | |||||||
Advisory fees | 96.0 | 88.7 | 8 | 16 | 380.3 | 345.7 | 10 | 17 | |||||||
Transaction fees and other | 5.9 | 10.9 | (46) | (42) | 39.8 | 33.6 | 18 | 27 | |||||||
Incentive fees | 9.5 | 56.4 | (83) | (83) | 26.6 | 93.9 | (72) | (69) | |||||||
Segment operating income | $ 26.7 | $ 40.4 | (34) % | (29) % | $ 90.1 | $ 101.7 | (11) % | (6) % | |||||||
Equity (losses) earnings | $ (3.6) | $ 17.9 | (120) % | (120) % | $ 0.4 | $ 62.7 | (99) % | (99) % | |||||||
Adjusted EBITDA1 | $ 24.7 | $ 59.5 | (58) % | (55) % | $ 96.6 | $ 171.0 | (44) % | (40) % | |||||||
Note: For discussion and reconciliation of non-GAAP financial measures, see the Notes following the Financial Statements in this news release. Percentage variances in the Performance Highlights below are calculated and presented on a local currency basis, unless otherwise noted. | |||||||||||||||
LaSalle advisory fee growth in the fourth quarter and the full year was concentrated in core open-end funds, driven by strong capital raising and increases in the fair value of assets under management over the trailing twelve months. Lower incentive fees for the quarter and full year reflected muted transaction activity given economic uncertainty and lower annual valuation gains in a U.S. fund, which followed an exceptional 2021. Consistent with trends in transaction activity across the rest of the company, LaSalle fourth-quarter transaction fees were notably lower than 2021.
The current quarter's equity losses were attributable to valuation declines in the co-investment portfolio. Prior-year equity earnings were substantially driven by valuation increases on underlying real estate investments within LaSalle's co-investment portfolio, as estimated fair values recovered from pandemic-era lows in 2020, coupled with share price appreciation for a co-investment in a LaSalle-managed publicly-traded REIT in Japan.
The fourth-quarter adjusted EBITDA margin, calculated on a fee-revenue basis, was 22.2% in USD (22.7% in local currency), compared with 38.1% in the prior-year quarter. The decline in margin was substantially driven by lower equity earnings and incentive fees. These drivers were partially offset by higher advisory fees and continued scale of the advisory fee platform.
The full-year adjusted EBITDA margin, calculated on a fee-revenue basis, was 21.6% in USD (21.4% in local currency), compared with 36.1% in 2021. The drivers of the margin contraction for the full year were consistent with the quarterly narrative noted above.
About JLL
JLL (NYSE: JLL) is a leading professional services firm that specializes in real estate and investment management. JLL shapes the future of real estate for a better world by using the most advanced technology to create rewarding opportunities, amazing spaces and sustainable real estate solutions for our clients, our people and our communities. JLL is a Fortune 500 company with annual revenue of $20.9 billion, operations in over 80 countries and a global workforce of more than 103,000 as of December 31, 2022. JLL is the brand name, and a registered trademark, of Jones Lang LaSalle Incorporated. For further information, visit ir.jll.com.
Connect with us
https://www.linkedin.com/company/jll
https://www.facebook.com/jll
https://twitter.com/jll
Live Webcast | Conference Call | ||
Management will offer a live webcast for shareholders, analysts and investment professionals on Tuesday, February 28, 2023, at 9:00 a.m. Eastern. Following the live broadcast, an audio replay will be available. The link to the live webcast and audio replay can be accessed at the Investor Relations website: ir.jll.com. | The conference call can be accessed live over the phone by dialing (844) 200-6205; the conference ID number is 817036. Listeners are asked to please dial in 10 minutes prior to the call start time and provide the conference ID number to be connected. | ||
Supplemental Information | Contact | ||
Supplemental information regarding the fourth quarter 2022 earnings call has been posted to the Investor Relations section of JLL's website: ir.jll.com. | If you have any questions, please contact Scott Einberger, Investor Relations Officer. | ||
Phone: | +1 312 252 8943 | ||
Email: | |||
Cautionary Note Regarding Forward-Looking Statements
Statements in this news release regarding, among other things, future financial results and performance, achievements, plans, objectives and shares repurchases may be considered forward-looking statements within the meaning of the Private Securities Litigation Reform Act of 1995. Such statements involve known and unknown risks, uncertainties, and other factors, the occurrence of which are outside JLL's control which may cause JLL's actual results, performance, achievements, plans, and objectives to be materially different from those expressed or implied by such forward-looking statements. For additional information concerning risks, uncertainties, and other factors that could cause actual results to differ materially from those anticipated in forward-looking statements, and risks to JLL's business in general, please refer to those factors discussed under "Risk Factors," "Business," "Management's Discussion and Analysis of Financial Condition and Results of Operations," "Quantitative and Qualitative Disclosures about Market Risk," and elsewhere in JLL's soon-to-be filed Annual Report on Form 10-K for the year ended December 31, 2022 and other reports filed with the Securities and Exchange Commission. Any forward-looking statements speak only as of the date of this release, and except to the extent required by applicable securities laws, JLL expressly disclaims any obligation or undertaking to publicly update or revise any forward-looking statements contained herein to reflect any change in expectations or results, or any change in events.
JONES LANG LASALLE INCORPORATED | |||||||
Consolidated Statements of Operations (Unaudited) | |||||||
Three Months Ended December 31, | Year Ended December 31, | ||||||
(in millions, except share and per share data) | 2022 | 2021 | 2022 | 2021 | |||
Revenue | $ 5,604.8 | $ 5,945.7 | $ 20,862.1 | $ 19,367.0 | |||
Operating expenses: | |||||||
Compensation and benefits | $ 2,549.4 | $ 2,921.5 | $ 10,010.8 | $ 9,535.4 | |||
Operating, administrative and other | 2,699.7 | 2,487.6 | 9,650.3 | 8,485.9 | |||
Depreciation and amortization | 62.6 | 57.2 | 228.1 | 217.5 | |||
Restructuring and acquisition charges3 | 38.4 | 33.8 | 104.8 | 84.7 | |||
Total operating expenses | $ 5,350.1 | $ 5,500.1 | $ 19,994.0 | $ 18,323.5 | |||
Operating income | $ 254.7 | $ 445.6 | $ 868.1 | $ 1,043.5 | |||
Interest expense, net of interest income | 26.1 | 9.5 | 75.2 | 40.1 | |||
Equity (losses) earnings | (21.6) | 102.7 | 51.0 | 209.4 | |||
Other income (loss)(a) | 14.3 | (2.1) | 150.3 | 10.8 | |||
Income before income taxes and noncontrolling interest | 221.3 | 536.7 | 994.2 | 1,223.6 | |||
Provision for income taxes | 45.4 | 115.9 | 200.8 | 264.3 | |||
Net income | 175.9 | 420.8 | 793.4 | 959.3 | |||
Net income (loss) attributable to noncontrolling interest(a) | 1.1 | (0.6) | 138.9 | (2.3) | |||
Net income attributable to common shareholders | $ 174.8 | $ 421.4 | $ 654.5 | $ 961.6 | |||
Basic earnings per common share | $ 3.68 | $ 8.37 | $ 13.51 | $ 18.89 | |||
Basic weighted average shares outstanding (in 000's) | 47,480 | 50,373 | 48,453 | 50,917 | |||
Diluted earnings per common share | $ 3.62 | $ 8.16 | $ 13.27 | $ 18.47 | |||
Diluted weighted average shares outstanding (in 000's) | 48,263 | 51,619 | 49,341 | 52,071 | |||
Please reference accompanying financial statement notes. | |||||||
(a) | During the second quarter of 2022, Other income included a $142.3 million gain by a consolidated variable interest entity in which the company held no equity interest. This gain, therefore, is also included in the period's net income attributable to noncontrolling interest. As a result, there is no net impact to Net income attributable to common shareholders (or other measures like Adjusted EBITDA, Adjusted net income and Adjusted diluted earnings per share). | |||||||
JONES LANG LASALLE INCORPORATED | |||||||
Selected Segment Financial Data (Unaudited) | |||||||
Three Months Ended December 31, | Year Ended December 31, | ||||||
(in millions) | 2022 | 2021 | 2022 | 2021 | |||
MARKETS ADVISORY | |||||||
Compensation and benefits | $ 876.9 | $ 991.4 | $ 3,301.5 | $ 3,122.0 | |||
Operating, administrative and other | 160.5 | 158.6 | 592.5 | 526.3 | |||
Depreciation and amortization | 21.5 | 20.4 | 73.5 | 69.4 | |||
Total segment operating expenses | 1,058.9 | 1,170.4 | 3,967.5 | 3,717.7 | |||
Gross contract costs1 | (271.0) | (263.7) | (1,055.3) | (987.0) | |||
Total fee-based segment operating expenses | $ 787.9 | $ 906.7 | $ 2,912.2 | $ 2,730.7 | |||
Segment operating income | $ 127.4 | $ 194.4 | $ 448.0 | $ 471.0 | |||
Add: | |||||||
Equity (losses) earnings | (1.0) | 0.1 | (0.3) | 0.7 | |||
Depreciation and amortization(a) | 20.6 | 20.4 | 70.6 | 69.4 | |||
Other income | 10.0 | 1.4 | 142.9 | 2.6 | |||
Net (income) loss attributable to noncontrolling interest | (0.8) | 1.1 | (138.2) | 3.2 | |||
Adjustments: | |||||||
Loss (gain) on disposition | — | — | 10.5 | (0.4) | |||
Interest on employee loans, net | (6.0) | — | (6.0) | — | |||
Adjusted EBITDA1 | $ 150.2 | $ 217.4 | $ 527.5 | $ 546.5 | |||
CAPITAL MARKETS | |||||||
Compensation and benefits | $ 408.8 | $ 650.2 | $ 1,729.6 | $ 1,770.2 | |||
Operating, administrative and other | 86.9 | 83.9 | 307.7 | 249.6 | |||
Depreciation and amortization | 15.4 | 15.4 | 61.6 | 63.1 | |||
Total segment operating expenses | 511.1 | 749.5 | 2,098.9 | 2,082.9 | |||
Gross contract costs1 | (10.8) | (13.3) | (47.0) | (48.0) | |||
Total fee-based segment operating expenses | $ 500.3 | $ 736.2 | $ 2,051.9 | $ 2,034.9 | |||
Segment operating income | $ 96.8 | $ 226.9 | $ 389.3 | $ 537.6 | |||
Add: | |||||||
Equity earnings | 1.0 | 1.8 | 3.1 | 4.9 | |||
Depreciation and amortization | 15.4 | 15.4 | 61.6 | 63.1 | |||
Other income (expense) | 4.6 | (3.4) | 4.7 | (3.1) | |||
Adjustments: | |||||||
Net non-cash MSR and mortgage banking derivative activity | 1.8 | (15.8) | (11.0) | (59.3) | |||
Interest on employee loans, net | (3.7) | — | (3.7) | — | |||
Adjusted EBITDA1 | $ 115.9 | $ 224.9 | $ 444.0 | $ 543.2 | |||
(a) | This adjustment excludes the noncontrolling interest portion of amortization of acquisition-related intangibles which is not attributable to common shareholders. |
JONES LANG LASALLE INCORPORATED | ||||||||
Selected Segment Financial Data (Unaudited) Continued | ||||||||
Three Months Ended December 31, | Year Ended December 31, | |||||||
(in millions) | 2022 | 2021 | 2022 | 2021 | ||||
WORK DYNAMICS | ||||||||
Compensation and benefits | $ 1,144.1 | $ 1,131.9 | $ 4,448.4 | $ 4,160.6 | ||||
Operating, administrative and other | 2,405.9 | 2,196.6 | 8,590.6 | 7,548.9 | ||||
Depreciation and amortization | 20.0 | 16.3 | 71.1 | 66.2 | ||||
Total segment operating expenses | 3,570.0 | 3,344.8 | 13,110.1 | 11,775.7 | ||||
Gross contract costs1 | (3,100.3) | (2,893.2) | (11,403.8) | (10,199.3) | ||||
Total fee-based segment operating expenses | $ 469.7 | $ 451.6 | $ 1,706.3 | $ 1,576.4 | ||||
Segment operating income | $ 64.6 | $ 52.0 | $ 158.4 | $ 115.8 | ||||
Add: | ||||||||
Equity (losses) earnings | (0.1) | 0.3 | 1.2 | 0.4 | ||||
Depreciation and amortization | 20.0 | 16.3 | 71.1 | 66.2 | ||||
Other expense | (0.3) | — | (0.2) | — | ||||
Net income attributable to noncontrolling interest | (0.3) | — | (0.4) | — | ||||
Adjusted EBITDA1 | $ 83.9 | $ 68.6 | $ 230.1 | $ 182.4 | ||||
JLL TECHNOLOGIES | ||||||||
Compensation and benefits(a) | $ 55.0 | $ 50.9 | $ 240.9 | $ 172.6 | ||||
Operating, administrative and other | 20.7 | 24.6 | 70.5 | 81.0 | ||||
Depreciation and amortization | 4.0 | 3.2 | 15.4 | 10.5 | ||||
Total segment operating expenses | 79.7 | 78.7 | 326.8 | 264.1 | ||||
Gross contract costs1 | (3.1) | (4.3) | (13.7) | (29.0) | ||||
Total fee-based segment operating expenses | $ 76.6 | $ 74.4 | $ 313.1 | $ 235.1 | ||||
Segment operating loss | $ (22.4) | $ (34.3) | $ (112.9) | $ (97.9) | ||||
Add: | ||||||||
Equity (losses) earnings | (17.9) | 82.6 | 46.6 | 140.7 | ||||
Depreciation and amortization | 4.0 | 3.2 | 15.4 | 10.5 | ||||
Other income | 0.1 | 0.1 | 3.0 | 12.1 | ||||
Adjustments: | ||||||||
Gain on disposition | — | — | (3.0) | (12.0) | ||||
Adjusted EBITDA1 | $ (36.2) | $ 51.6 | $ (50.9) | $ 53.4 | ||||
(a) | Included in Compensation and benefits expenses for JLL Technologies is carried interest expense related to qualifying equity earnings of the segment. There was no carried interest for the three months ended December 31, 2022, and $16.6 million for the year ended December 31, 2022. For the three and twelve months ended December 31, 2021, carried interest expense was $3.1 million and $12.6 million, respectively. | ||||||||
JONES LANG LASALLE INCORPORATED | ||||||||
Selected Segment Financial Data (Unaudited) Continued | ||||||||
Three Months Ended December 31, | Year Ended December 31, | |||||||
(in millions) | 2022 | 2021 | 2022 | 2021 | ||||
LASALLE | ||||||||
Compensation and benefits | $ 64.6 | $ 97.2 | $ 290.4 | $ 310.1 | ||||
Operating, administrative and other | 25.7 | 23.8 | 89.0 | 80.0 | ||||
Depreciation and amortization | 1.7 | 1.9 | 6.5 | 8.3 | ||||
Total segment operating expenses | 92.0 | 122.9 | 385.9 | 398.4 | ||||
Gross contract costs1 | (7.3) | (7.3) | (29.3) | (26.9) | ||||
Total fee-based segment operating expenses | $ 84.7 | $ 115.6 | $ 356.6 | $ 371.5 | ||||
Segment operating income | $ 26.7 | $ 40.4 | $ 90.1 | $ 101.7 | ||||
Add: | ||||||||
Equity (losses) earnings | (3.6) | 17.9 | 0.4 | 62.7 | ||||
Depreciation and amortization | 1.7 | 1.9 | 6.5 | 8.3 | ||||
Other expense | (0.1) | (0.2) | (0.1) | (0.8) | ||||
Net income attributable to noncontrolling interest | — | (0.5) | (0.3) | (0.9) | ||||
Adjusted EBITDA1 | $ 24.7 | $ 59.5 | $ 96.6 | $ 171.0 | ||||
JONES LANG LASALLE INCORPORATED | |||
Summarized Consolidated Statements of Cash Flows4 (Unaudited) | |||
Year Ended December 31, | |||
(in millions) | 2022 | 2021 | |
Net cash provided by operating activities | $ 199.9 | $ 972.4 | |
Net cash used in investing activities | (243.1) | (805.8) | |
Net cash used in financing activities | (13.1) | (143.8) | |
Effect of currency exchange rate changes on cash, cash equivalents and restricted cash | (39.3) | (21.0) | |
Net change in cash, cash equivalents and restricted cash | $ (95.6) | $ 1.8 | |
Cash, cash equivalents and restricted cash, beginning of year | 841.6 | 839.8 | |
Cash, cash equivalents and restricted cash, end of period | $ 746.0 | $ 841.6 | |
Reconciliation to Free Cash Flow | |||
Year Ended December 31, | |||
(in millions) | 2022 | 2021 | |
Net cash provided by operating activities | $ 199.9 | $ 972.4 | |
Net capital additions - property and equipment | (205.8) | (175.9) | |
Free Cash Flow6 | $ (5.9) | $ 796.5 | |
Please reference accompanying financial statement notes. | |||
JONES LANG LASALLE INCORPORATED | ||||||||||||
Consolidated Balance Sheets | ||||||||||||
December 31, | December 31, | December 31, | December 31, | |||||||||
(in millions, except share and per share data) | 2022 | 2021 | 2022 | 2021 | ||||||||
ASSETS | LIABILITIES AND EQUITY | |||||||||||
Current assets: | Current liabilities: | |||||||||||
Cash and cash equivalents | $ 519.3 | $ 593.7 | Accounts payable and accrued liabilities | $ 1,236.8 | $ 1,262.8 | |||||||
Trade receivables, net of allowance | 2,148.8 | 2,004.1 | Reimbursable payables | 1,579.5 | 1,350.0 | |||||||
Notes and other receivables | 469.5 | 389.3 | Accrued compensation and benefits | 1,749.8 | 2,029.5 | |||||||
Reimbursable receivables | 2,005.7 | 1,734.5 | Short-term borrowings | 164.2 | 147.9 | |||||||
Warehouse receivables | 463.2 | 822.3 | Current maturities of long-term debt, net | — | 274.7 | |||||||
Short-term contract assets, net of allowance | 359.7 | 343.1 | Short-term contract liability and deferred income | 216.5 | 208.2 | |||||||
Prepaid and other | 603.5 | 500.7 | Short-term acquisition-related obligations | 23.1 | 45.8 | |||||||
Total current assets | 6,569.7 | 6,387.7 | Warehouse facilities | 455.3 | 795.7 | |||||||
Property and equipment, net of accumulated depreciation | 582.9 | 740.0 | Short-term operating lease liability | 156.4 | 153.8 | |||||||
Operating lease right-of-use asset | 776.3 | 723.4 | Other | 330.5 | 218.1 | |||||||
Goodwill | 4,528.0 | 4,611.6 | Total current liabilities | 5,912.1 | 6,486.5 | |||||||
Identified intangibles, net of accumulated amortization | 858.5 | 887.0 | Noncurrent liabilities: | |||||||||
Investments | 873.8 | 745.7 | Credit facility, net of debt issuance costs | 1,213.8 | 138.2 | |||||||
Long-term receivables | 331.1 | 316.4 | Long-term debt, net of debt issuance costs | 372.8 | 395.6 | |||||||
Deferred tax assets, net | 379.6 | 330.8 | Long-term deferred tax liabilities, net | 194.0 | 179.7 | |||||||
Deferred compensation plans | 517.9 | 528.8 | Deferred compensation | 492.4 | 525.4 | |||||||
Other | 175.9 | 233.6 | Long-term acquisition-related obligations | 76.3 | 66.3 | |||||||
Total assets | $ 15,593.7 | $ 15,505.0 | Long-term operating lease liability | 775.8 | 714.4 | |||||||
Other | 407.0 | 577.7 | ||||||||||
Total liabilities | $ 9,444.2 | $ 9,083.8 | ||||||||||
Redeemable noncontrolling interest | $ 7.0 | $ 7.8 | ||||||||||
Company shareholders' equity | ||||||||||||
Common stock | 0.5 | 0.5 | ||||||||||
Additional paid-in capital | 2,022.6 | 2,053.7 | ||||||||||
Retained earnings | 5,590.4 | 4,937.6 | ||||||||||
Treasury stock | (934.6) | (406.3) | ||||||||||
Shares held in trust | (9.8) | (5.2) | ||||||||||
Accumulated other comprehensive loss | (648.2) | (395.4) | ||||||||||
Total company shareholders' equity | 6,020.9 | 6,184.9 | ||||||||||
Noncontrolling interest | 121.6 | 228.5 | ||||||||||
Total equity | 6,142.5 | 6,413.4 | ||||||||||
Total liabilities and equity | $ 15,593.7 | $ 15,505.0 | ||||||||||
Please reference accompanying financial statement notes. | ||||||||||||
JONES LANG LASALLE INCORPORATED
Financial Statement Notes
1. Management uses certain non-GAAP financial measures to develop budgets and forecasts, measure and reward performance against those budgets and forecasts, and enhance comparability to prior periods. These measures are believed to be useful to investors and other external stakeholders as supplemental measures of core operating performance and include the following:
(i) Fee revenue and Fee-based operating expenses,
(ii) Adjusted EBITDA attributable to common shareholders ("Adjusted EBITDA") and Adjusted EBITDA margin,
(iii) Adjusted net income attributable to common shareholders and Adjusted diluted earnings per share,
(iv) Percentage changes against prior periods, presented on a local currency basis, and
(v) Free Cash Flow.
However, non-GAAP financial measures should not be considered alternatives to measures determined in accordance with U.S. generally accepted accounting principles ("GAAP"). Any measure that eliminates components of a company's capital structure, cost of operations or investments, or other results has limitations as a performance measure. In light of these limitations, management also considers GAAP financial measures and does not rely solely on non-GAAP financial measures. Because the company's non-GAAP financial measures are not calculated in accordance with GAAP, they may not be comparable to similarly titled measures used by other companies.
Adjustments to GAAP Financial Measures Used to Calculate non-GAAP Financial Measures
Gross Contract Costs represent certain costs associated with client-dedicated employees and third-party vendors and subcontractors and are directly or indirectly reimbursed through the fees we receive. These costs are presented on a gross basis in Operating expenses with the equal amount of corresponding fees in Revenue. Excluding gross contract costs from both Fee revenue and Fee-based operating expenses more accurately reflects how the company manages its expense base and operating margins and also enables a more consistent performance assessment across a portfolio of contracts with varying payment terms and structures.
Net Non-Cash Mortgage Servicing Rights ("MSR") and Mortgage Banking Derivative Activity consists of the balances presented within Revenue composed of (i) derivative gains/losses resulting from mortgage banking loan commitment and warehousing activity and (ii) gains recognized from the retention of MSR upon origination and sale of mortgage loans, offset by (iii) amortization of MSR intangible assets over the period that net servicing income is projected to be received. Non-cash derivative gains/losses resulting from mortgage banking loan commitment and warehousing activity are calculated as the estimated fair value of loan commitments and subsequent changes thereof, primarily represented by the estimated net cash flows associated with future servicing rights. MSR gains and corresponding MSR intangible assets are calculated as the present value of estimated cash flows over the estimated mortgage servicing periods. The above activity is reported entirely within Revenue of the Capital Markets segment. Excluding net non-cash MSR and mortgage banking derivative activity reflects how the company manages and evaluates performance because the excluded activity is non-cash in nature.
Restructuring and Acquisition Charges primarily consist of: (i) severance and employment-related charges, including those related to external service providers, incurred in conjunction with a structural business shift, which can be represented by a notable change in headcount, change in leadership or transformation of business processes; (ii) acquisition, transaction and integration-related charges, including fair value adjustments, which are generally non-cash in the periods such adjustments are made, to assets and liabilities recorded in purchase accounting such as earn-out liabilities and intangible assets; and (iii) lease exit charges. Such activity is excluded as the amounts are generally either non-cash in nature or the anticipated benefits from the expenditures would not likely be fully realized until future periods. Restructuring and acquisition charges are excluded from segment operating results and therefore are not line items in the segments' reconciliation to Adjusted EBITDA.
Amortization of Acquisition-Related Intangibles, primarily composed of the estimated fair value ascribed at closing of an acquisition to assets such as acquired management contracts, customer backlog and relationships, and trade name, is more notable following the company's increase in acquisition activity in recent years. Such non-cash activity is excluded as the change in period-over-period activity is generally the result of longer-term strategic decisions and therefore not necessarily indicative of core operating results.
Gain or Loss on Disposition reflects the gain or loss recognized on the sale of businesses. Given the low frequency of business disposals by the company historically, the gain or loss directly associated with such activity is excluded as it is not considered indicative of core operating performance. In 2022, the $7.5 million net loss from the second quarter included $10.5 million of loss related to the disposition of the Russia business, partially offset by a $3.0 million gain related to a disposition within JLL Technologies. In 2021, $12.0 million of the activity related to a business disposition within JLL Technologies during the first quarter and $0.4 million related to a sold business within Markets Advisory during the third quarter.
Interest on Employee Loans, Net of Forgiveness reflects interest accrued on employee loans less the amount of accrued interest forgiven. Certain employees (predominantly in our Leasing and Capital Markets businesses) receive cash payments structured as loans, with interest. Employees earn forgiveness of the loan based on performance, generally calculated as a percentage of revenue production, annually. Such forgiven amounts are reflected in Compensation and benefits expense. Given the interest accrued on these employee loans and subsequent forgiveness are non-cash and the amounts perfectly offset over the life of the loan, the activity is not indicative of core operating performance and is excluded from non-GAAP measures.
Reconciliation of Non-GAAP Financial Measures
Below are reconciliations of (i) Revenue to Fee revenue and (ii) Operating expenses to Fee-based operating expenses:
Three Months Ended December 31, | Year Ended December 31, | ||||||
(in millions) | 2022 | 2021 | 2022 | 2021 | |||
Revenue | $ 5,604.8 | $ 5,945.7 | $ 20,862.1 | $ 19,367.0 | |||
Gross contract costs1 | (3,392.5) | (3,181.8) | (12,549.1) | (11,290.2) | |||
Net non-cash MSR and mortgage banking derivative activity | 1.8 | (15.8) | (11.0) | (59.3) | |||
Fee revenue | $ 2,214.1 | $ 2,748.1 | $ 8,302.0 | $ 8,017.5 | |||
Operating expenses | $ 5,350.1 | $ 5,500.1 | $ 19,994.0 | $ 18,323.5 | |||
Gross contract costs1 | (3,392.5) | (3,181.8) | (12,549.1) | (11,290.2) | |||
Fee-based operating expenses | $ 1,957.6 | $ 2,318.3 | $ 7,444.9 | $ 7,033.3 | |||
Below is (i) a reconciliation of Net income attributable to common shareholders to EBITDA and Adjusted EBITDA, (ii) the Net income margin attributable to common shareholders (against Revenue), and (iii) the Adjusted EBITDA margin (presented on a local currency and on a fee-revenue basis). Following this are the (i) reconciliation to adjusted net income and (ii) components of adjusted diluted earnings per share.
Three Months Ended December 31, | Year Ended December 31, | ||||||
($ in millions) | 2022 | 2021 | 2022 | 2021 | |||
Net income attributable to common shareholders | $ 174.8 | $ 421.4 | $ 654.5 | $ 961.6 | |||
Add: | |||||||
Interest expense, net of interest income | 26.1 | 9.5 | 75.2 | 40.1 | |||
Provision for income taxes | 45.4 | 115.9 | 200.8 | 264.3 | |||
Depreciation and amortization(a) | 61.7 | 57.2 | 225.2 | 217.5 | |||
EBITDA | $ 308.0 | $ 604.0 | $ 1,155.7 | $ 1,483.5 | |||
Adjustments: | |||||||
Restructuring and acquisition charges3 | 38.4 | 33.8 | 104.8 | 84.7 | |||
Net loss (gain) on disposition | — | — | 7.5 | (12.4) | |||
Net non-cash MSR and mortgage banking derivative activity | 1.8 | (15.8) | (11.0) | (59.3) | |||
Interest on employee loans, net of forgiveness | (9.7) | — | (9.7) | — | |||
Adjusted EBITDA | $ 338.5 | $ 622.0 | $ 1,247.3 | $ 1,496.5 | |||
Net income margin attributable to common shareholders | 3.1 % | 7.1 % | 3.1 % | 5.0 % | |||
Adjusted EBITDA margin | 15.5 % | 22.6 % | 15.0 % | 18.7 % | |||
Three Months Ended December 31, | Year Ended December 31, | ||||||
(In millions, except share and per share data) | 2022 | 2021 | 2022 | 2021 | |||
Net income attributable to common shareholders | $ 174.8 | $ 421.4 | $ 654.5 | $ 961.6 | |||
Diluted shares (in thousands) | 48,263 | 51,619 | 49,341 | 52,071 | |||
Diluted earnings per share | $ 3.62 | $ 8.16 | $ 13.27 | $ 18.47 | |||
Net income attributable to common shareholders | $ 174.8 | $ 421.4 | $ 654.5 | $ 961.6 | |||
Adjustments: | |||||||
Restructuring and acquisition charges3 | 38.4 | 33.8 | 104.8 | 84.7 | |||
Net non-cash MSR and mortgage banking derivative activity | 1.8 | (15.8) | (11.0) | (59.3) | |||
Amortization of acquisition-related intangibles(a) | 17.9 | 14.6 | 67.4 | 53.3 | |||
Net loss (gain) on disposition | — | — | 7.5 | (12.4) | |||
Interest on employee loans, net of forgiveness | (9.7) | — | (9.7) | — | |||
Tax impact of adjusted items(b) | (12.6) | (7.0) | (38.4) | (14.3) | |||
Adjusted net income attributable to common shareholders | $ 210.6 | $ 447.0 | $ 775.1 | $ 1,013.6 | |||
Diluted shares (in thousands) | 48,263 | 51,619 | 49,341 | 52,071 | |||
Adjusted diluted earnings per share | $ 4.36 | $ 8.66 | $ 15.71 | $ 19.47 | |||
(a) | This adjustment excludes the noncontrolling interest portion of amortization of acquisition-related intangibles which is not attributable to common shareholders. |
(b) | For the second and fourth quarters of 2022, the tax impact of adjusted items was calculated using the applicable statutory rates by tax jurisdiction. For the first and third quarters of 2022 and all quarters of 2021, the tax impact of adjusted items was calculated using the consolidated effective tax rate as this was deemed to approximate the tax impact of adjusted items calculated using applicable statutory tax rates. |
Operating Results - Local Currency
In discussing operating results, the company reports Adjusted EBITDA margins and refers to percentage changes in local currency, unless otherwise noted. Amounts presented on a local currency basis are calculated by translating the current period results of foreign operations to U.S. dollars using the foreign currency exchange rates from the comparative period. Management believes this methodology provides a framework for assessing performance and operations excluding the effect of foreign currency fluctuations.
The following table reflects the reconciliation to local currency amounts for consolidated (i) revenue, (ii) fee revenue, (iii) operating income and (iv) Adjusted EBITDA.
Three Months Ended December 31, | Year Ended December 31, | ||||||
($ in millions) | 2022 | % Change | 2022 | % Change | |||
Revenue: | |||||||
At current period exchange rates | $ 5,604.8 | (6) % | $ 20,862.1 | 8 % | |||
Impact of change in exchange rates | 232.7 | n/a | 708.4 | n/a | |||
At comparative period exchange rates | $ 5,837.5 | (2) % | $ 21,570.5 | 11 % | |||
Fee revenue: | |||||||
At current period exchange rates | $ 2,214.1 | (19) % | $ 8,302.0 | 4 % | |||
Impact of change in exchange rates | 92.4 | n/a | 282.6 | n/a | |||
At comparative period exchange rates | $ 2,306.5 | (16) % | $ 8,584.6 | 7 % | |||
Operating income: | |||||||
At current period exchange rates | $ 254.7 | (43) % | $ 868.1 | (17) % | |||
Impact of change in exchange rates | 7.4 | n/a | 14.9 | n/a | |||
At comparative period exchange rates | $ 262.1 | (41) % | $ 883.0 | (15) % | |||
Adjusted EBITDA: | |||||||
At current period exchange rates | $ 338.5 | (46) % | $ 1,247.3 | (17) % | |||
Impact of change in exchange rates | 19.7 | n/a | 38.0 | n/a | |||
At comparative period exchange rates | $ 358.2 | (42) % | $ 1,285.3 | (14) % | |||
2. As part of the last phase of the company's Beyond transformation, effective January 1, 2022, the company changed from its geographic-centric Real Estate Services segments of Americas, EMEA and Asia Pacific to global business line segments of Markets Advisory, Capital Markets, Work Dynamics and JLL Technologies. The company's real estate investment management business, LaSalle, continues as a reporting segment. Beginning with the first quarter of 2022, the company's financial results are presented on this basis. Comparable periods in 2021 have been recast to align with the new reporting structure.
3. Restructuring and acquisition charges are excluded from the company's measure of segment operating results, although they are included within consolidated Operating income calculated in accordance with GAAP. For purposes of segment operating results, the allocation of restructuring and acquisition charges to the segments is not a component of management's assessment of segment performance. The table below shows restructuring and acquisition charges.
Three Months Ended December 31, | Year Ended December 31, | ||||||
(in millions) | 2022 | 2021 | 2022 | 2021 | |||
Severance and other employment-related charges | $ 23.5 | $ 12.2 | $ 44.5 | $ 14.3 | |||
Restructuring, pre-acquisition and post-acquisition charges | 18.4 | 20.0 | 63.6 | 67.8 | |||
Fair value adjustments that resulted in a net (decrease) increase to earn-out liabilities from prior-period acquisition activity | (3.5) | 1.6 | (3.3) | 2.6 | |||
Total restructuring and acquisition charges | $ 38.4 | $ 33.8 | $ 104.8 | $ 84.7 | |||
4. The consolidated statements of cash flows are presented in summarized form. For complete consolidated statements of cash flows, please refer to the company's Form 10-K for the year ended December 31, 2022, to be filed with the SEC in the near future.
5. As of December 31, 2022, LaSalle had $79.1 billion of real estate assets under management ("AUM"), composed of $36.9 billion invested in separate accounts, $39.3 billion invested in fund management vehicles and $2.9 billion invested in public securities. The geographic distribution of separate accounts and fund management investments was $31.1 billion in North America, $17.7 billion in the UK, $13.1 billion in Asia Pacific and $6.5 billion in continental Europe. The remaining $7.8 billion relates to Global Partner Solutions which is a global business line.
AUM decreased 3% in USD (increased 1% in local currency) from $81.7 billion as of September 30, 2022. The AUM change resulted from (i) $3.6 billion of foreign currency decreases and (ii) $1.2 billion of dispositions and withdrawals, partially offset by (iii) $2.0 billion of acquisitions and (iv) $0.2 billion of net valuation increases.
Assets under management data for separate accounts and fund management amounts are reported on a one-quarter lag. In addition, LaSalle raised $5.2 billion in private equity capital for the quarter ended December 31, 2022, bringing the full-year capital raise to $9.7 billion.
6. "Net Debt" is defined as the sum of the (i) Credit facility, (ii) Long-term debt and (iii) Short-term borrowings liability balances less Cash and cash equivalents.
"Net Leverage Ratio" is defined as Net Debt divided by the trailing-twelve-month adjusted EBITDA.
"Corporate Liquidity" is defined as the unused portion of the company's Credit Facility plus cash and cash equivalents.
"Free Cash Flow" is defined as cash provided by operating activities less net capital additions - property and equipment.
"EMEA" is defined as Europe, Middle East and Africa.
7. The company defines "Resilient" revenue as (i) Property Management, within Markets Advisory, (ii) Valuation Advisory and Loan Servicing, within Capital Markets, (iii) Workplace Management, within Work Dynamics, (iv) JLL Technologies, and (v) Advisory Fees (within LaSalle). The company defines "Transactional" revenue as (i) Leasing and Advisory, Consulting and Other, within Markets Advisory, (ii) Investment Sales, Debt/Equity Advisory and Other, within Capital Markets, (iii) Project Management and Portfolio Services and Other, within Work Dynamics, and (iv) Incentive fees and Transaction fees and other, within LaSalle.
8. n.m.: "not meaningful", represented by a percentage change of greater than 1,000%, favorably or unfavorably.
Appendix: Revenue and Fee Revenue Segment Detail | |||||||||||||||||||||||
Three Months Ended December 31, 2022 | |||||||||||||||||||||||
(in millions) | Markets Advisory | Capital Markets | Work Dynamics | ||||||||||||||||||||
Leasing | Property | Advisory, | Total | Invt Sales, | Valuation | Loan | Total | Workplace | Project | Portfolio | Total | JLLT | LaSalle | Total | |||||||||
Revenue | $ 746.6 | 398.8 | 40.9 | $ 1,186.3 | $ 464.6 | 106.2 | 37.1 | $ 607.9 | $ 2,635.7 | 856.9 | 142.0 | $ 3,634.6 | $ 57.3 | $ 118.7 | $ 5,604.8 | ||||||||
Gross contract costs1 | (6.7) | (262.3) | (2.0) | (271.0) | (8.3) | (2.5) | — | (10.8) | (2,433.4) | (606.8) | (60.1) | (3,100.3) | (3.1) | (7.3) | (3,392.5) | ||||||||
Net non-cash MSR and | — | — | — | — | 1.8 | — | — | 1.8 | — | — | — | — | — | — | 1.8 | ||||||||
Fee revenue | $ 739.9 | 136.5 | 38.9 | $ 915.3 | $ 458.1 | 103.7 | 37.1 | $ 598.9 | $ 202.3 | 250.1 | 81.9 | $ 534.3 | $ 54.2 | $ 111.4 | $ 2,214.1 | ||||||||
Three Months Ended December 31, 2021 | |||||||||||||||||||||||
(in millions) | Markets Advisory | Capital Markets | Work Dynamics | ||||||||||||||||||||
Leasing | Property | Advisory, | Total | Invt Sales, | Valuation | Loan | Total | Workplace | Project | Portfolio | Total | JLLT | LaSalle | Total | |||||||||
Revenue | $ 934.2 | 391.2 | 39.4 | $ 1,364.8 | $ 824.2 | 111.1 | 41.1 | $ 976.4 | $ 2,437.5 | 807.5 | 151.8 | $ 3,396.8 | $ 44.4 | $ 163.3 | $ 5,945.7 | ||||||||
Gross contract costs1 | (5.6) | (257.4) | (0.7) | (263.7) | (11.2) | (2.1) | — | (13.3) | (2,260.9) | (574.6) | (57.7) | (2,893.2) | (4.3) | (7.3) | (3,181.8) | ||||||||
Net non-cash MSR and | — | — | — | — | (15.8) | — | — | (15.8) | — | — | — | — | — | — | (15.8) | ||||||||
Fee revenue | $ 928.6 | 133.8 | 38.7 | $ 1,101.1 | $ 797.2 | 109.0 | 41.1 | $ 947.3 | $ 176.6 | 232.9 | 94.1 | $ 503.6 | $ 40.1 | $ 156.0 | $ 2,748.1 | ||||||||
Appendix: Revenue and Fee Revenue Segment Detail (continued) | |||||||||||||||||||||||
Year Ended December 31, 2022 | |||||||||||||||||||||||
(in millions) | Markets Advisory | Capital Markets | Work Dynamics | ||||||||||||||||||||
Leasing | Property | Advisory, | Total | Invt Sales, | Valuation | Loan | Total | Workplace | Project | Portfolio | Total | JLLT | LaSalle | Total | |||||||||
Revenue | $ 2,759.2 | 1,525.3 | 131.0 | $ 4,415.5 | $ 1,955.4 | 374.9 | 157.9 | $ 2,488.2 | $ 9,819.2 | 2,972.3 | 477.0 | $ 13,268.5 | $ 213.9 | $ 476.0 | $ 20,862.1 | ||||||||
Gross contract costs1 | (22.5) | (1,025.1) | (7.7) | (1,055.3) | (37.7) | (9.3) | — | (47.0) | (9,066.4) | (2,121.6) | (215.8) | (11,403.8) | (13.7) | (29.3) | (12,549.1) | ||||||||
Net non-cash MSR and | — | — | — | — | (11.0) | — | — | (11.0) | — | — | — | — | — | — | (11.0) | ||||||||
Fee revenue | $ 2,736.7 | 500.2 | 123.3 | $ 3,360.2 | $ 1,906.7 | 365.6 | 157.9 | $ 2,430.2 | $ 752.8 | 850.7 | 261.2 | $ 1,864.7 | $ 200.2 | $ 446.7 | $ 8,302.0 | ||||||||
Year Ended December 31, 2021 | |||||||||||||||||||||||
(in millions) | Markets Advisory | Capital Markets | Work Dynamics | ||||||||||||||||||||
Leasing | Property | Advisory, | Total | Invt Sales, | Valuation | Loan | Total | Workplace | Project | Portfolio | Total | JLLT | LaSalle | Total | |||||||||
Revenue | $ 2,618.1 | 1,437.9 | 132.7 | $ 4,188.7 | $ 2,111.0 | 369.3 | 140.2 | $ 2,620.5 | $ 8,731.5 | 2,684.9 | 475.1 | $ 11,891.5 | $ 166.2 | $ 500.1 | $ 19,367.0 | ||||||||
Gross contract costs1 | (19.6) | (959.2) | (8.2) | (987.0) | (38.5) | (9.5) | — | (48.0) | (8,076.6) | (1,910.7) | (212.0) | (10,199.3) | (29.0) | (26.9) | (11,290.2) | ||||||||
Net non-cash MSR and | — | — | — | — | (59.3) | — | — | (59.3) | — | — | — | — | — | — | (59.3) | ||||||||
Fee revenue | $ 2,598.5 | 478.7 | 124.5 | $ 3,201.7 | $ 2,013.2 | 359.8 | 140.2 | $ 2,513.2 | $ 654.9 | 774.2 | 263.1 | $ 1,692.2 | $ 137.2 | $ 473.2 | $ 8,017.5 | ||||||||
![]()
![]() View original content to download multimedia:https://www.prnewswire.com/news-releases/jll-reports-financial-results-for-fourth-quarter-and-full-year-2022-301757353.html
View original content to download multimedia:https://www.prnewswire.com/news-releases/jll-reports-financial-results-for-fourth-quarter-and-full-year-2022-301757353.html
SOURCE JLL-IR
